Activity overview
The activity overview section provides a visual summary of all LinkedIn activities performed through Flowkon during the selected date range. The data is displayed as an interactive graph, making it easy to track outreach performance, identify activity trends, and measure engagement over time.
Users can customize the graph by selecting different activity types available below the chart. Each option updates the graph to display statistics for that specific LinkedIn action.
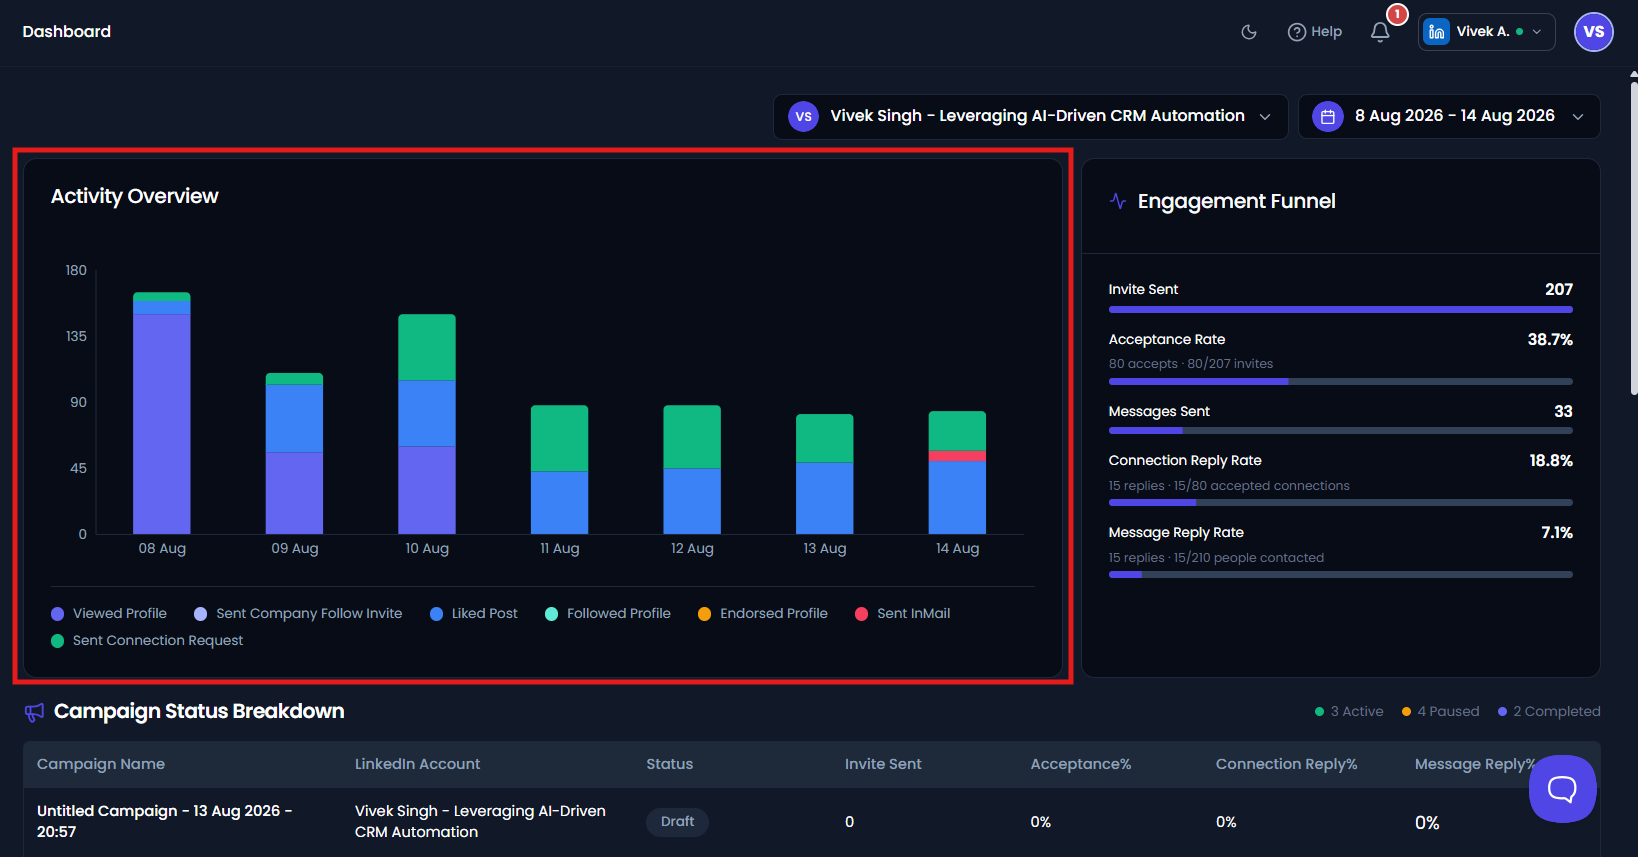
The available activity types include:
- Viewed Profile – Displays the number of LinkedIn profiles viewed by your campaigns over the selected period.
- Followed Profile – Shows the total number of LinkedIn follow actions performed.
- Liked Post – Displays the number of LinkedIn posts liked through your campaigns.
- Sent Company Follow Invites – Shows the total number of invitations sent to follow company pages.
- Endorsed Profile – Displays the number of LinkedIn skill endorsements sent.
- Sent InMail – Shows the number of LinkedIn InMail messages sent to prospects.
- Sent Connection Request– Displays the total number of LinkedIn connection requests sent.
The graph automatically updates based on the selected activity and the chosen date range, allowing you to compare daily activity levels and monitor campaign performance. This helps you identify periods of high or low outreach activity and understand how your LinkedIn engagement has changed over time.